One of the most valuable things I’ve learned in my career is the benefits of joining different data tables to uncover SEO insights and opportunities that would otherwise be missed. Tools like Botify and OnCrawl use data from a physical crawl, backlinks, keyword footprint, analytics, Google Search Console, and log files, and they do a great job of presenting the data in a way that makes sense and tells a story.
Still, these tools can be pricey and don’t allow for tweaks and customizations to their proprietary systems. However, with a free tool like Microsoft PowerBI, we can combine different data sources to discover issues and opportunities, then be better prepared to prioritize them holistically or take a deep dive into competitors’ websites. Using this guide, you can look at a website from a very high level and drill down into the issues and opportunities you find, from keywords and content opportunities to technical SEO.

Need an Example of How This Would Work?
Say you’ve crawled a website and learned that 20% of the URL inventory returns a 404 not-found HTTP response. Based on this alone, we might recommend removing all internal links to 404 URLs to reduce the overall threshold of indexable to non-indexable pages. Unfortunately, this activity would take time and resources and may not produce measurable KPI value.
However, if we join the crawl data with keyword exports from SEMRush, backlinks from AHREFs, and clicks/impressions from Google Search Console, we can see which 404-status URLs have tangible SEO value. In this case, we might discover that a few URLs have a decent keyword footprint and some valuable referring domains. Perhaps one has a couple thousand impressions and a few clicks in the last 30 days. With that data, we can now prioritize reclaiming the potential SEO value already living in the currently not-found URLs.
This workflow will teach you to take CSV exports from a ScreamingFrog crawl and an Organic Search Traffic report from SEMRush. At the end of this workflow, you can view keyword data at the directory and URL levels for every page in your inventory.
Gather the Data
1. Crawl your website with ScreamingFrog and export internal_all.
2. Visit SEMRush and export Organic Search Traffic.
Import the CSV Files, One at a Time, into PowerBI
We will start with internal_all.csv
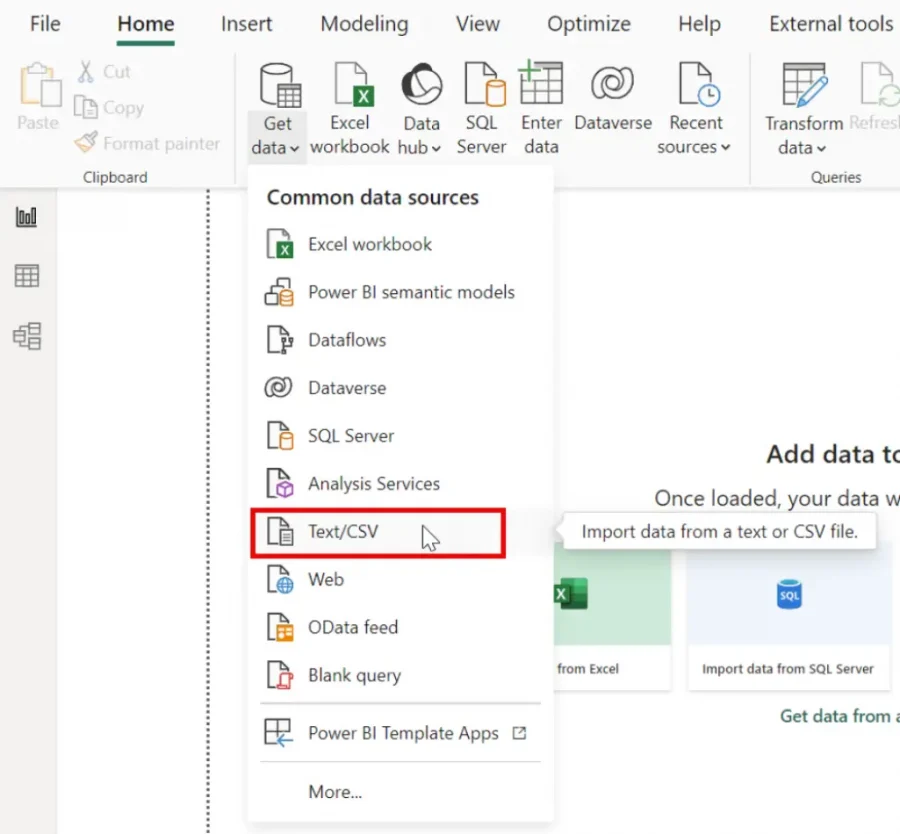
3. Open PowerBI and, in the upper left, click Get data > Text/CSV
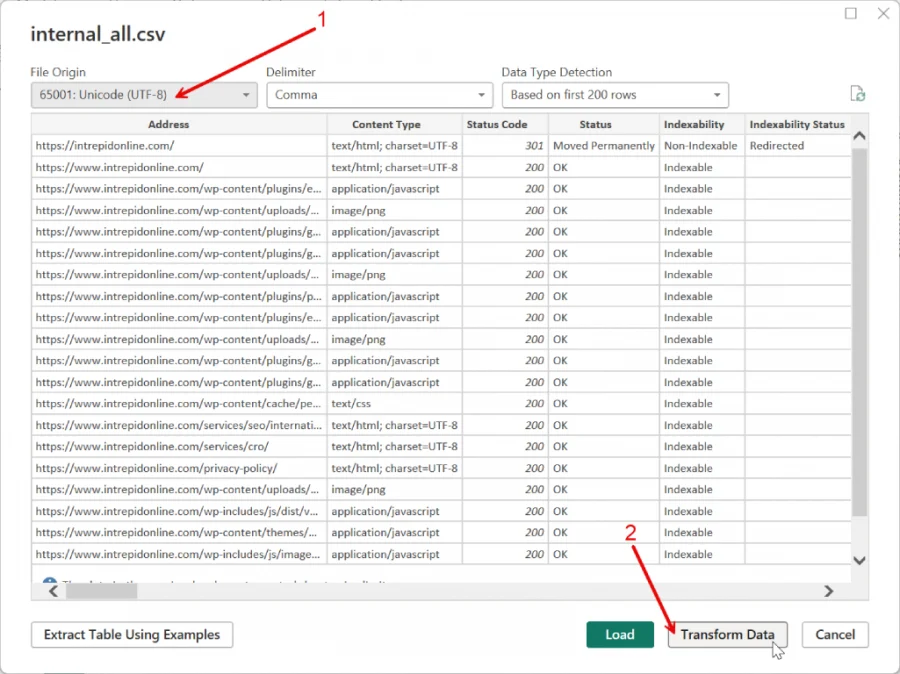
4. Choose UTF-8 as the File Origin on the next screen, and click Transform.
Clean and Join the Data
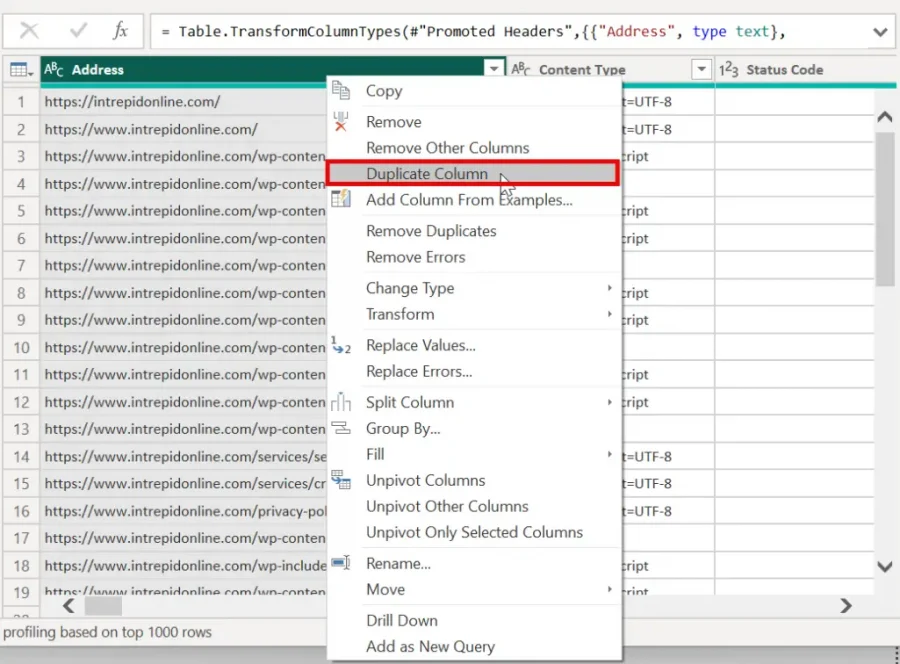
5. Right-click on the header of the Address column and choose Duplicate Column.
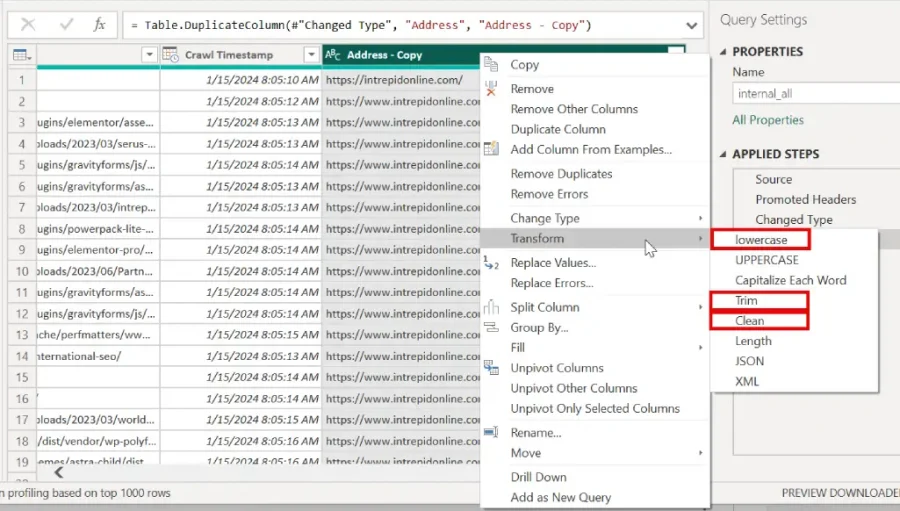
6. Right-click on the header of the new column (Address – Copy), choose Transform in the dropdown menu, and click Lowercase.
7. Repeat this step, click Trim, repeat it again, and click Clean.
8. Double-click on the new column header and rename it Key.
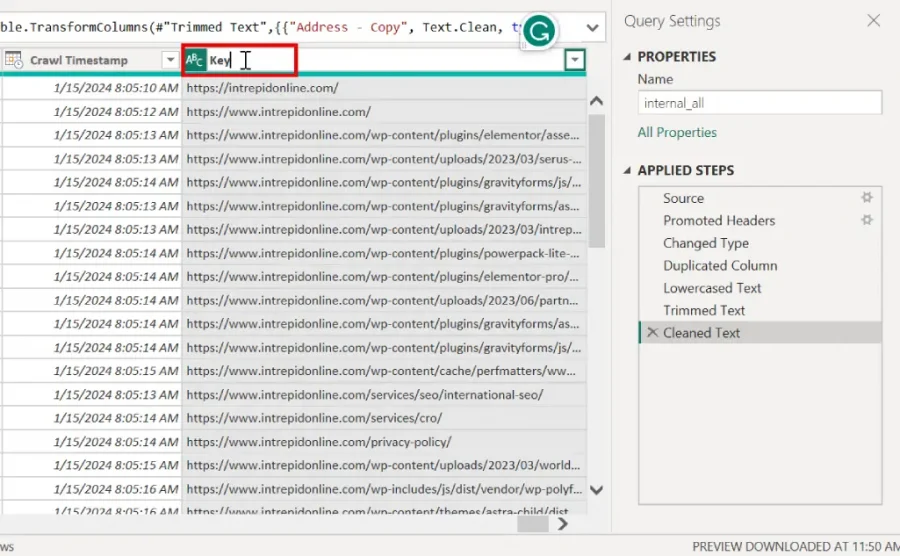
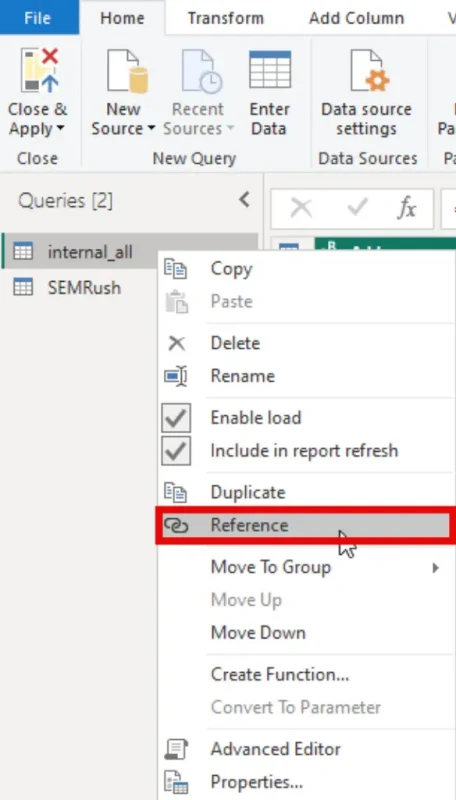
9. In the Queries panel on the left, right-click internal_all and choose Reference. This will create a copy of your internal_all table linked to the original.
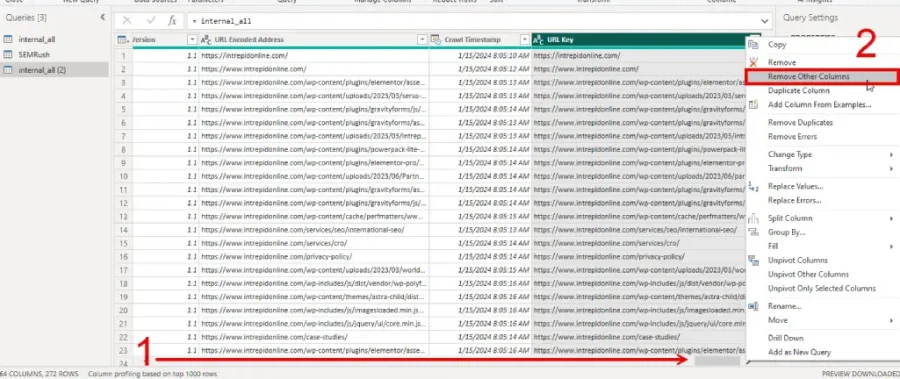
10. All the way to the right of the table, right-click the header of the Key column and choose Remove Other Columns.
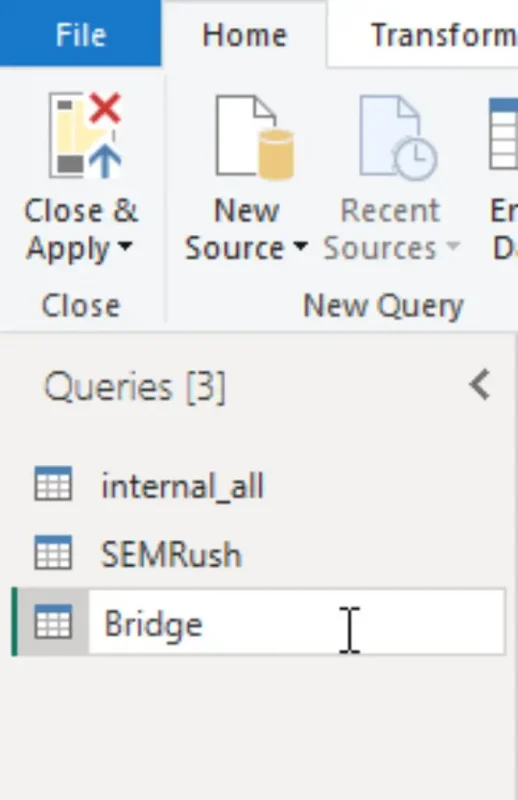
11. Double-click internal_all (2) in the Queries pane on the left and rename it Bridge.
12. Repeat the process with your SEMRush export.
- In SEMrush, duplicate the URL column.
- Repeat steps 6-10
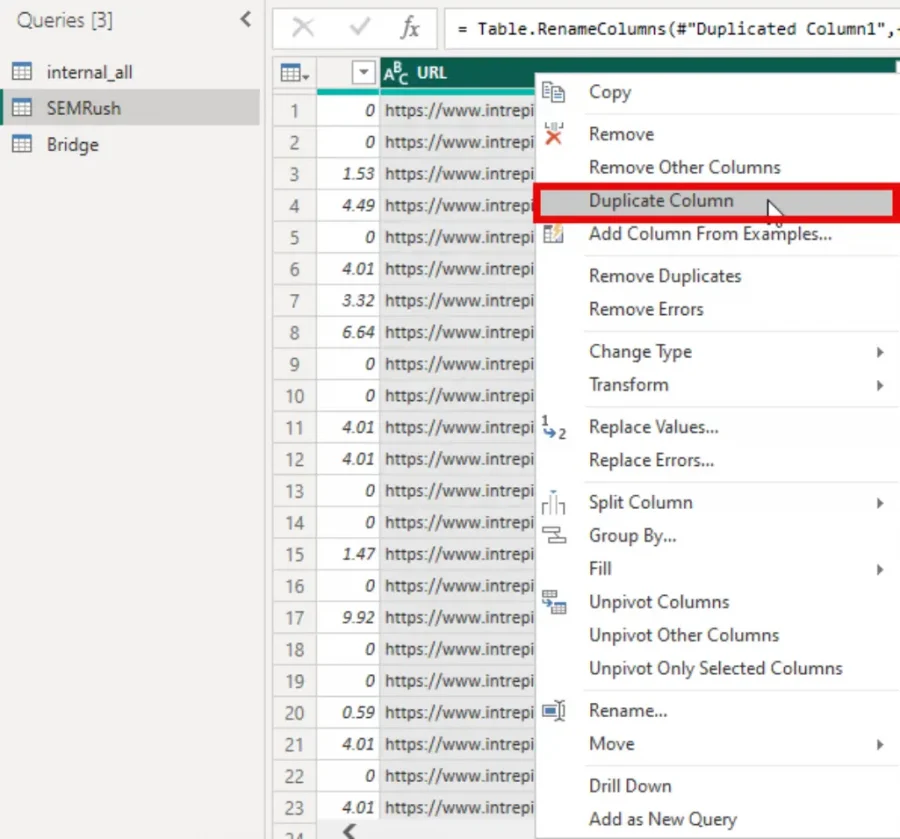
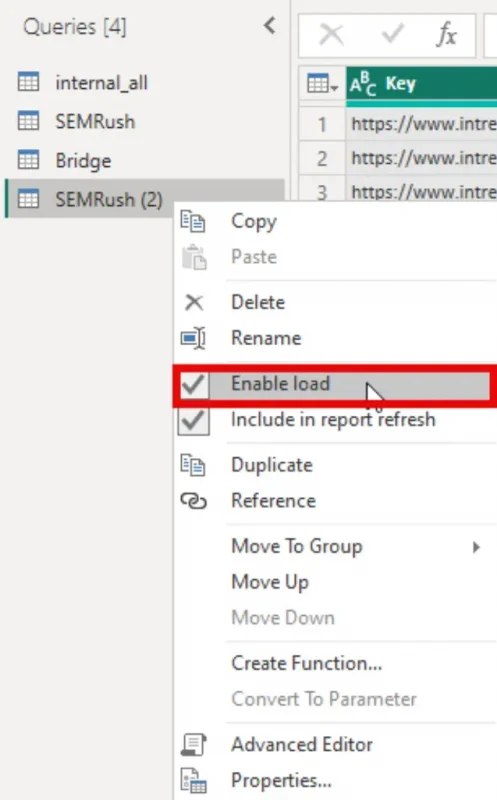
13. Next, we want to prevent PowerBI from loading the SEMRush reference table into the data model. This will allow PowerBI to work with a full inventory of URLs without having to load more data into the dashboard than necessary.
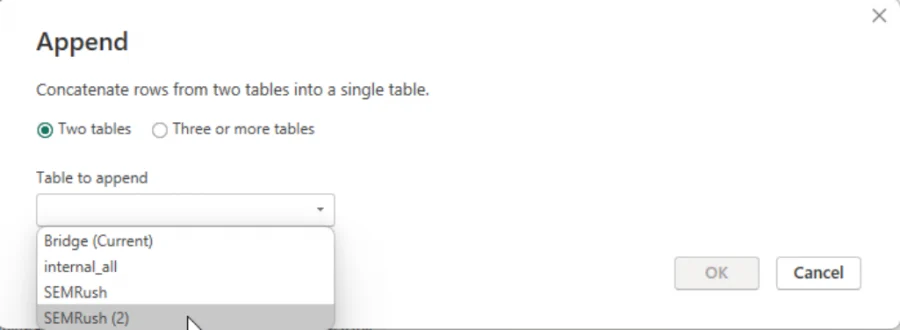
14. With the Bridge table selected, click Append Queries in the top right.

15. Leave Two tables selected and choose SEMRush (2) from the dropdown.
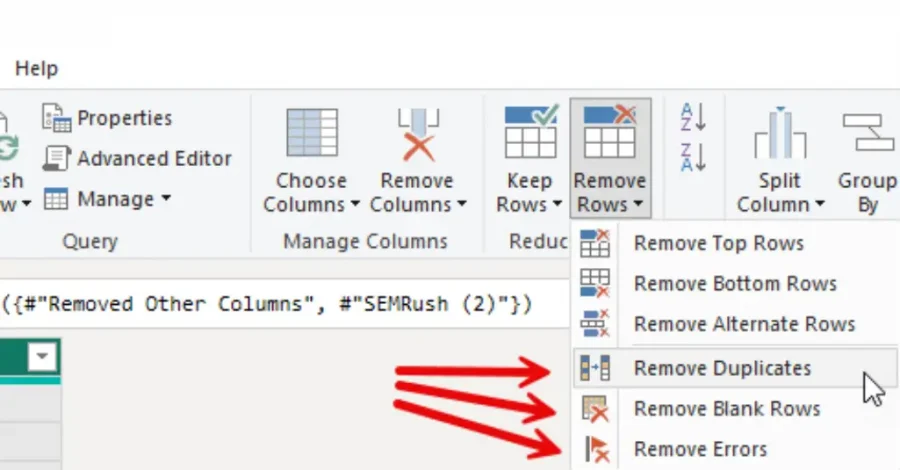
16. At this point, your Bridge table should have a full list of every URL from both data sources. Naturally, there will be duplication. Next, click Remove Rows at the top and choose Remove Duplicates.
17. Repeat this step twice more, choosing Remove Blank Rows, then Remove Errors.
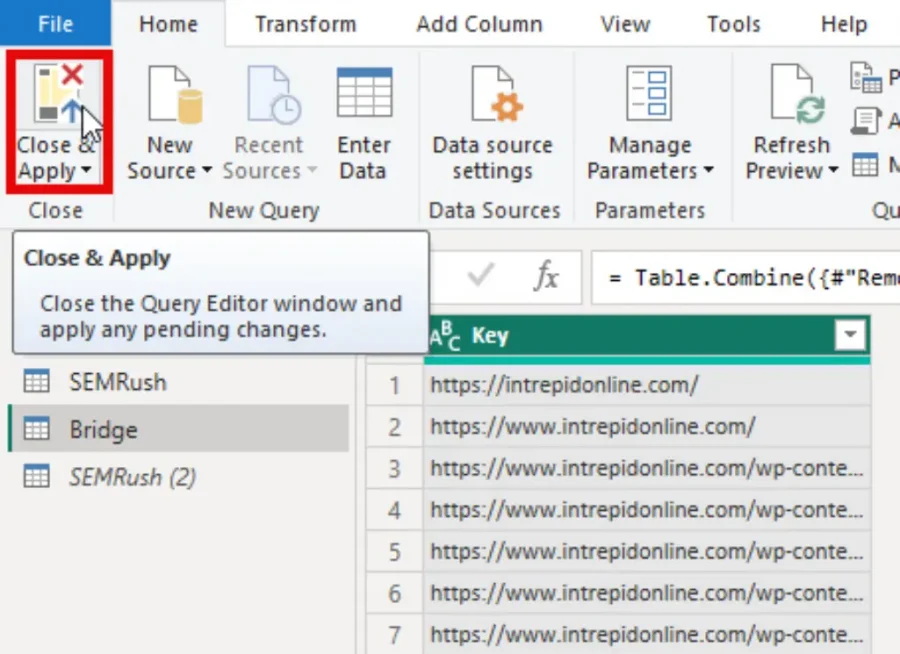
18. Click Close & Apply in the top left.
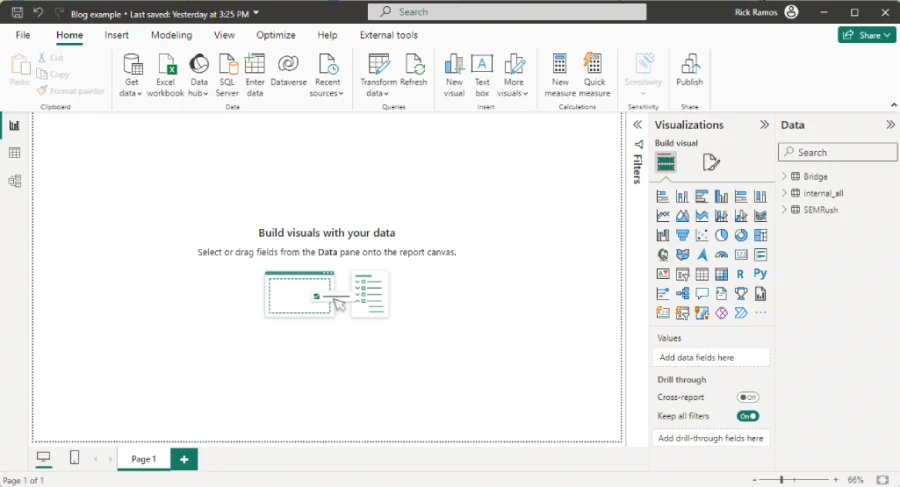
After the loading screen has completed, your interface should look similar to this:
Define the Relationship
The next part is where the rubber hits the road. This involves joining the internal_all and SEMRush tables using the Bridge.
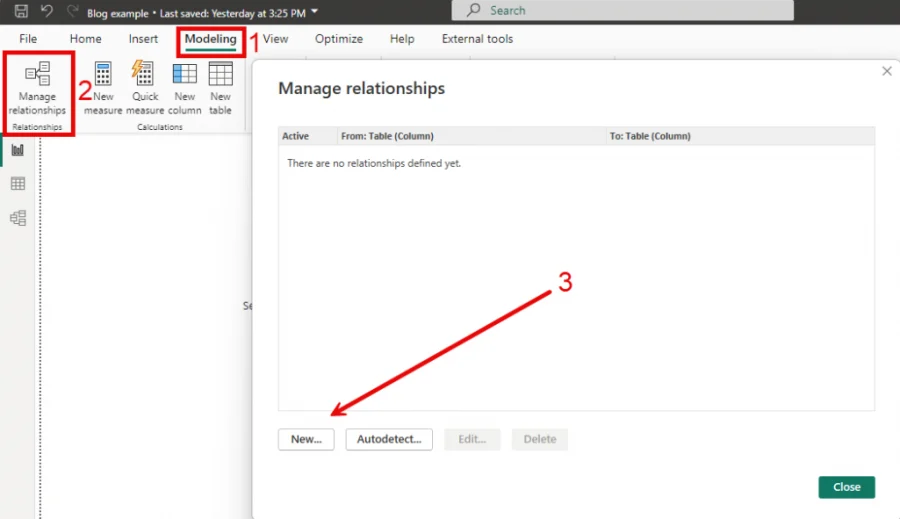
1. Click Modeling in the menu at the top. Next, click Manage Relationships, then New…
At this point, there may be predefined relationships listed. If so, delete those—we’re doing this from scratch today.
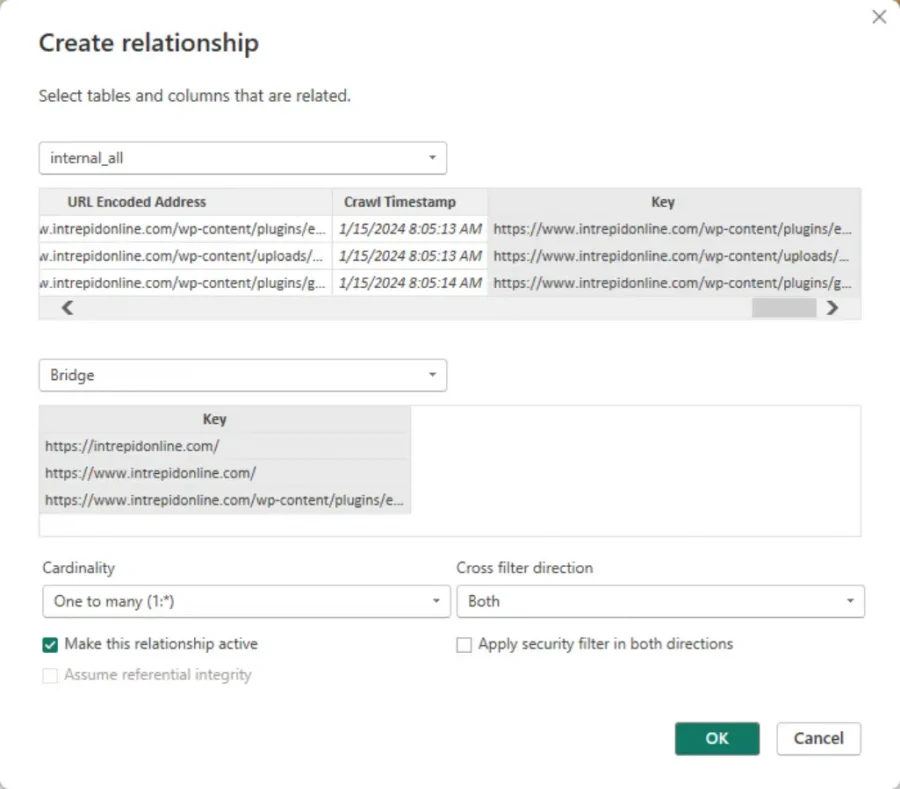
2. In the top dropdown, choose internal_all, and Bridge in the second dropdown.
3. The two Key columns should be highlighted. If they are not, click on the Key column in each table.
4. Ensure the Cardinality is One to Many (1:*). If this is not an option, something went wrong. Go back and check your work.
5. Set Cross filter direction to Both.
Now, your screen should look like this:
6. Click OK.
7. Repeat steps 1 through 6 to join the SEMRush table to the Bridge.
8. Click Close in the Manage Relationships window.
Turning Data into Information
Congratulations! Now your ScreamingFrog export is joined with SEMRush, and you can use the numbers together. Here is an example:
The Bridge table is our primary inventory of URLs. In this data model, the Bridge Key is where we always start. I created a Table from the Visualizations pane. I added the key column from the Bridge table, indexability from internal_all, and the number of keywords the URL is ranking for from SEMRush. If we have any non-indexable URLs with an organic keyword footprint, we will find them here.

Keep in mind these are just the basics. In future posts, I will go into greater detail about gathering and joining tables in more complicated ways and creating snappy visualizations to help you discover and illustrate the stories hidden in your data. Stay tuned!
