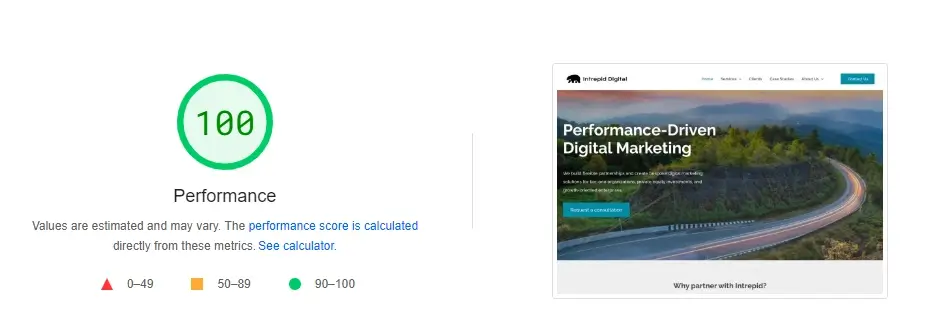
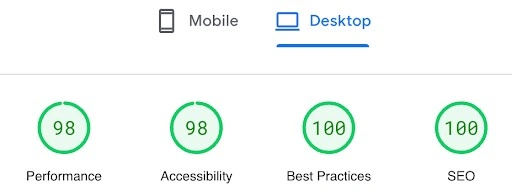
When we recently launched our own new website, we took great care to optimize performance and Core Web Vitals scores. Here’s a snapshot of our results from PageSpeed Insights:
Look at all that green!


Why does performance matter?
Every one second delay in page load time can cause conversions to fall by up to 20%. Again, that’s for every one second delay.
Website performance is a significant ranking factor for SEO and indirectly affects larger websites through crawl budget optimization. Faster-loading pages consume fewer resources from search engines, leading to better crawl efficiency and potentially better indexing. Read more about our technical SEO and on-page SEO services.
How can I check these metrics for my own site?
Simply enter your website URL on PageSpeed Insights to get a general read of your performance metrics. To get the detail for each page, you can use PageSpeed Insights API with Screaming Frog, This is the tool that Intrepid Digital uses to monitor page speed for our own site and clients’ sites on an ongoing basis. (For details on files that affect loading time, visit the Catchpoint website.)
How to improve your own site's scores:
- Reduce server response time (look at your provider, configuration, caching, etc.)
- Use CDNs to reduce the distance between users and your server
- Choose a light template
- Remove unnecessary plugins
- Minify and concatenate code files
- Compress and optimize image sizes
- Cache static content
- Lazy load content below the fold (images and videos)
If these metrics are showing orange (or even red) for my site, how worried should I be?
If the above stats are showing orange or red for your website, it means there’s room for improvement. To help assess the severity of the situation, manually test the different templates and check the bounce rate (now “engagement rate” in GA4).
If you have a very large website with many pages and your stats are red, you may find it harder and harder to maintain high scores due to the complexity of the site. (And errors become more common with custom integrations that are often found on very large sites). In these cases, it’s more impactful to focus on UX, indexing, and conversions. These are closely tied to poor performance scores and you’ll want to prioritize the issues you can in order to make incremental improvements.
The third metric shown in this dashboard is labeled “Best Practices.” What does that measure?
- Make sure your page has the HTML doctype. Without it, you may trigger quirks mode in older browsers.
- Avoid browser errors logged to the console. These indicate unresolved problems, which can come from network request failures and other browser concerns.
- Display images with the correct aspect ratio. Learn how to display responsive images properly.
- Use HTTP/2 for all resources. It’s important for your page load time.
- Avoid using document.write(). It can damage page load time.
- Use passive listeners to improve page scrolling performance.
- Safely link to cross-origin destinations
- Replace JavaScript libraries with known security vulnerabilities
- Ensure CSP is effective against cross-site scripting (XSS) attacks
- Request geolocation permission on page load
- Request notification permission on page load
- Migrate your web page from Application Cache to the Cache API
- Remove and replace deprecated APIs from your web page
- Utilize Lighthouse’s diagnostic “Detected JavaScript libraries” audit
Can Intrepid Digital do this for me?
Yes! We specialize in a range of services—SEO, CRO, content strategy, and more—all geared toward improving your ranking, conversions, revenue, and overall performance.
